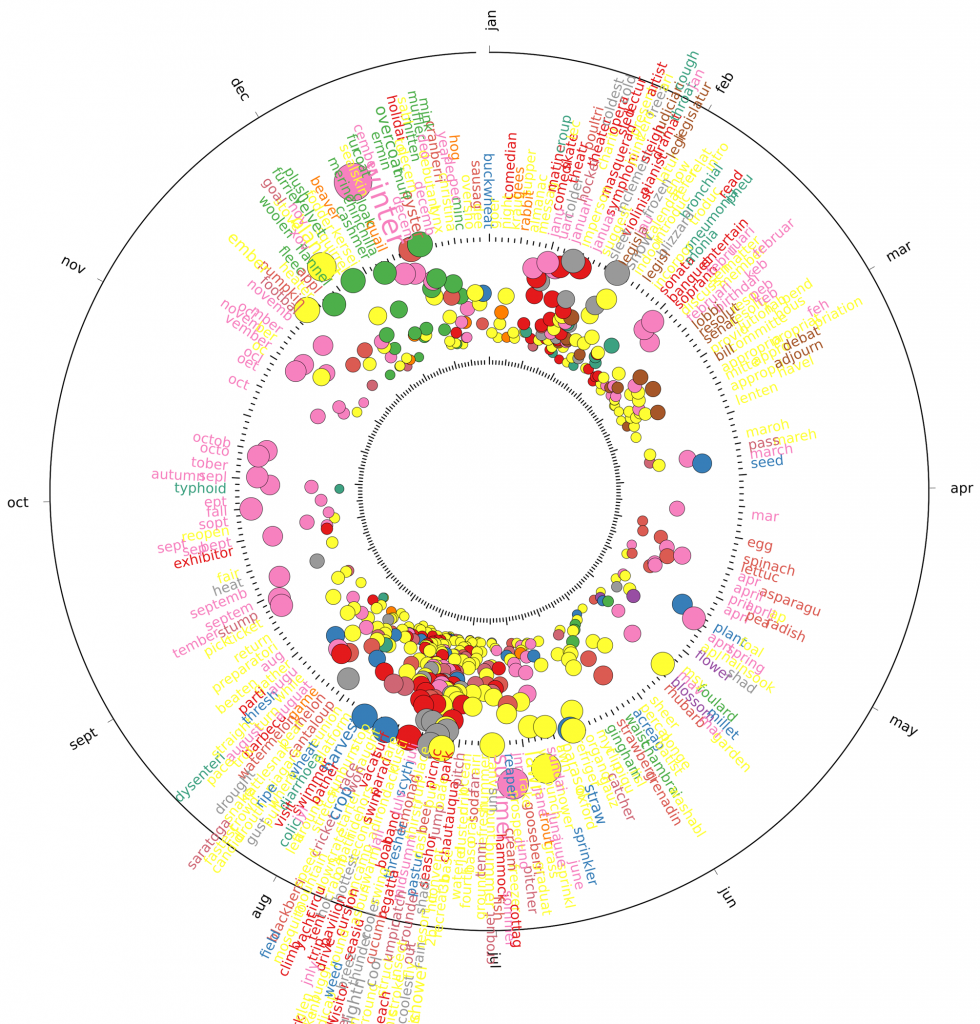
Discovering Periodic Patterns in Vast News Corpora

New research has revealed that by using big data to analyse massive data sets of modern and historical news, social media and Wikipedia page views, periodic patterns in the collective behaviour of the population can be observed that could otherwise go unnoticed.
Academics from the University of Bristol’s ThinkBIG project, led by Nello Cristianini, Professor of Artificial Intelligence, have published two papers that have analysed periodic patterns in daily media content and consumption: the first investigated historical newspapers, the second Twitter posts and Wikipedia visits.
The two sets of findings, taken together, show that people’s collective behaviour follows strong periodic patterns and is more predictable than previously thought. However, these patterns can often only be revealed when analysing the activities of a large number of people for a very long time, and until recently this has been a very difficult task.
By using big data technologies it is now possible to obtain a unified look at newspaper content, for dozens of newspapers at the same time, spanning several decades or to analyse the contents posted on Twitter by large numbers of users, or even the Wikipedia pages visited.
Professor Nello Cristianini, from the Department of Engineering Mathematics, said: “What emerges is a glimpse at the regularities in our behaviour that are hidden behind the day-to-day variations in our lives.
“Our two papers have shown that by analysing massive data sets of modern and historical news, social media and Wikipedia page views, we can obtain an unprecedented look at our collective behaviour, revealing cycles that we certainly suspected, but that have never been observed before.”
The first paper, published in the journal PLOS ONE, analysed 87 years of US and UK newspapers between 1836 and 1922. The researchers found people’s leisure and work were strongly regulated by the weather and seasons, with words like picnic or excursion consistently peaking every summer in the UK and US.
Much of our diet was influenced by the seasons too, with very predictable peak times for different fruits and foods, and even flowers, in the historical news. The same was found for diseases, such as the peak season for measles in both countries was found to be in late March to early April. Interestingly, a strong indicator was provided by the very periodic re-appearance of gooseberries every June, which is no longer found in modern news, along with many other lost traditions.
This may seem obvious, but the research team also noticed that certain activities that used to be highly regular, like Christmas lectures, have now all but disappeared, and have been replaced by other periodic activities, like football, Ibiza, Oktoberfest. In some ways, the TV has partly replaced the weather as a major factor of synchronisation of people’s lives.
In the second paper, to be presented next month at a workshop at the 2016 IEEE International Conference on Data Mining (ICDM), the researchers discovered that seasons may also have strong effects on mental health. The team analysed the aggregate sentiment in Twitter in the UK, plus aggregate Wikipedia access over four years. They found that negative sentiment is overexpressed in the winter, peaking in November, and anxiety and anger are overexpressed between September and April.
At the same time, an analysis of Wikipedia visits for mental health pages, globally but strongly dominated by northern hemisphere traffic, showed clear seasonality in searches for specific forms of mental issues. For example, visits to the page on seasonal affective disorder peaks in late December and panic disorder visits peak in April, at the same time as visits to the page on acute stress disorder.
Together, these two articles show that the use of multiple sources of big data can enable researchers to look at the collective behaviour, and even the mood and mental health, of large populations, revealing cycles for the first time that have been suspected but were difficult to observe.
Papers
- Discovering Periodic Patterns in Historical News by Fabon Dzogang, Thomas Lansdall-Welfare, FindMyPast Newspaper Team, and Nello Cristianini in PLOS ONE.
- Seasonal Fluctuations in Collective Mood Revealed by Wikipedia Searches and Twitter Posts by Fabon Dzogang, Thomas Lansdall-Welfare, and Nello Cristianini in SENTIRE Workshop at IEEE International Conference on Data Mining 2016.
This research was supported by ERC Advanced Grant ThinkBIG.
